Best Time of Year to Buy a Gun
We tracked 6,075 firearms every month from March to August 2026. The calendar moved them less than one percent — the retailer you picked moved them six times more.

Is there actually a cheapest month to buy a gun?
Not in our data, and we were surprised by how flatly the question answered itself.
We built a matched basket: every firearm in our catalog that recorded at least one price in every month from March through August 2026. That is 6,075 guns, averaging $1,022.31. A matched basket matters because a raw monthly average would mostly measure which products entered and left the catalog, not what prices did.
Each gun was then indexed against its own six-month average, so a $400 shotgun and a $3,000 over-under count equally.
| Month (2026) | Firearm price index | Mean basket price |
|---|---|---|
| March | 99.63 | $1,017.83 |
| April | 99.81 | $1,019.29 |
| May | 99.97 | $1,022.37 |
| June | 100.21 | $1,024.79 |
| July | 100.34 | $1,026.62 |
| August | 100.04 | $1,022.97 |
Seven tenths of one percent, end to end, and the direction is up. On a $1,000 rifle that is roughly seven dollars of drift across half a year — less than the sales tax difference between two neighbouring counties, and far less than the transfer fee you will pay regardless.
Do any gun categories have their own season?
This is where we expected to find something. Hunting rifles ought to soften in spring; defensive handguns ought to firm up in autumn. Neither shows up.
| Category (2026) | March | May | July | August |
|---|---|---|---|---|
| Bolt Action Rifles | 99.40 | 99.90 | 100.46 | 100.36 |
| Semi Auto Handguns | 99.69 | 100.13 | 100.28 | 99.68 |
| Revolvers | 99.31 | 100.02 | 100.43 | 100.28 |
| 1911 | 99.48 | 99.87 | 100.29 | 100.71 |
| Modern Sporting Rifles | 99.43 | 99.98 | 100.57 | 100.03 |
| Lever Action Rifles | 99.56 | 99.83 | 100.43 | 100.44 |
| Semi Auto Shotguns | 99.50 | 99.83 | 100.40 | 100.60 |
| Pump Shotguns | 100.05 | 99.91 | 100.36 | 99.68 |
Nine categories, one shape. Everything sits marginally under its own average in March and marginally over it by midsummer. That uniformity is itself the finding: if bolt guns really discounted in the off-season, they would separate from handguns on this table, and they do not. Whatever is moving these numbers is a slow catalog-wide drift, not a seasonal promotion cycle.
If you are shopping that first category, the clean centerfire end of it looks like this today:
Centerfire Bolt Guns, Cheapest First
Prices updated Oct 28, 2026
Mossberg Patriot Bolt-Action Rifle Blued/Synthetic .243Win 22-inch 5 Rds
.243 Winchester

Mossberg Patriot Rifle .270 Win 22.0 Barrel 5-Rounds
.270 Winchester

Mossberg Patriot Rifle 350 Legend 22-inch 4Rds
.350 Legend
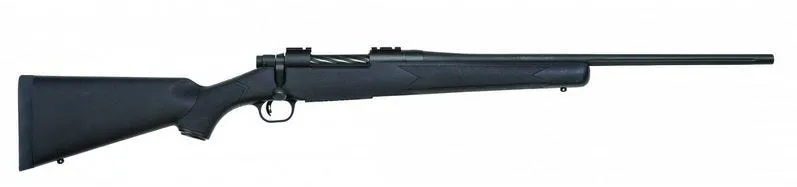
Mossberg Patriot Rifle 25-06Rem 22-inch 5RD

Mossberg Patriot .450 BM 20 Barrel 4-Rounds
.450 Bushmaster

Mossberg Patriot .308 Win 22 Barrel 5-Rounds
.308 Win
Our picks-with-reasons version of that decision is in best bolt action rifles for hunting, and every tracked Mossberg listing is one click away.
So when did individual guns hit their low?
Ask the question per-gun rather than per-market and it gets more interesting. Of the 5,769 basket guns whose price moved at all, here is the month each one was at its own cheapest:
| Month (2026) | Share hitting their six-month low |
|---|---|
| March | 35.0% |
| April | 4.7% |
| May | 4.0% |
| June | 3.5% |
| July | 23.7% |
| August | 29.0% |
Read that with care, because the shape is partly an artifact. March and August are the ends of the window, and the endpoints of any drifting series over-represent both extremes — March also accounts for 39.4% of the six-month highs, and August for 28.7%. Endpoints are where both records get set.
What survives the caveat is the middle. April, May and June together contain only 12.2% of the lows. Whatever else our window shows, late spring was not when guns went on sale.
How much does one gun move, really?
This is the number worth acting on:
- Median six-month swing per gun: 3.00% (cheapest month to dearest month, as a share of its own average).
- 5.0% of the basket never changed price at all, and 27.1% moved less than one percent.
- 34.1% swung 5% or more. 12.4% swung 10% or more. Only 2.5% swung 20% or more.
So the market is flat, but roughly one gun in eight is genuinely volatile. That is the practical takeaway: there is no "best month," there is a best moment for your specific gun, and it is invisible unless something is watching that listing. Setting a target price and being told when it is hit beats guessing at a calendar.
Get alerted when 9mm price drops hit.
We watch every listing and email you the moment the cost per round drops.
Set Up a Free Price AlertThe gap between retailers beats the calendar, every time
Here is the comparison that ends the argument. Right now, 7,067 firearms in our catalog are listed in stock by more than one tracked retailer. Across those guns:
- The cheapest-to-dearest gap averages 6.45%, or $56.21.
- 41.8% show a gap of 5% or more.
- 21.7% show a gap of 10% or more.
- The widest single gap in the set is 121.8% — the same gun, more than twice the price, from a different shop on the same day.
The average retailer gap is more than double the median gun's entire six-month swing. You do not have to wait for it, it does not require predicting anything, and it is available on whatever Tuesday you happen to be shopping. This is the same effect we measured on the ammunition side in which retailer is actually cheapest — it is simply larger and less examined on hardware.
Sorting a category by price shows you the floor of the catalog, which is a different thing from the floor on a given model. Revolvers make the point plainly:
Cheapest Revolvers Tracked Right Now
Prices updated Oct 28, 2026
Heritage Firearms Rough Rider .22 LR 4.75 Barrel 6-Rounds Zamak Frame
.22LR

Heritage Firearms Rough Rider .22 LR 6.5 Barrel 6-Rounds Zamak Frame
.22LR
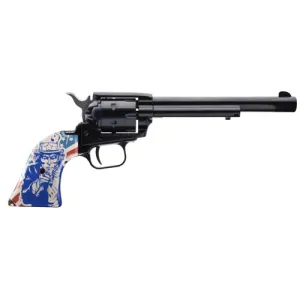
Heritage Firearms Rough Rider Small Bore .22 LR 6.5 Barrel 6-Rounds
.22 LR · 6 rds
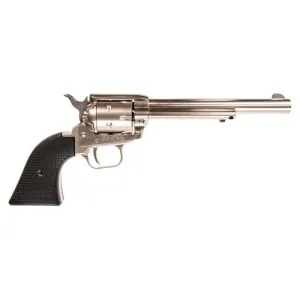
Heritage Firearms Rough Rider Nickel .22 LR 6.5 Barrel 6-Rounds Black Polymer Grips
.22 LR · 6 rds
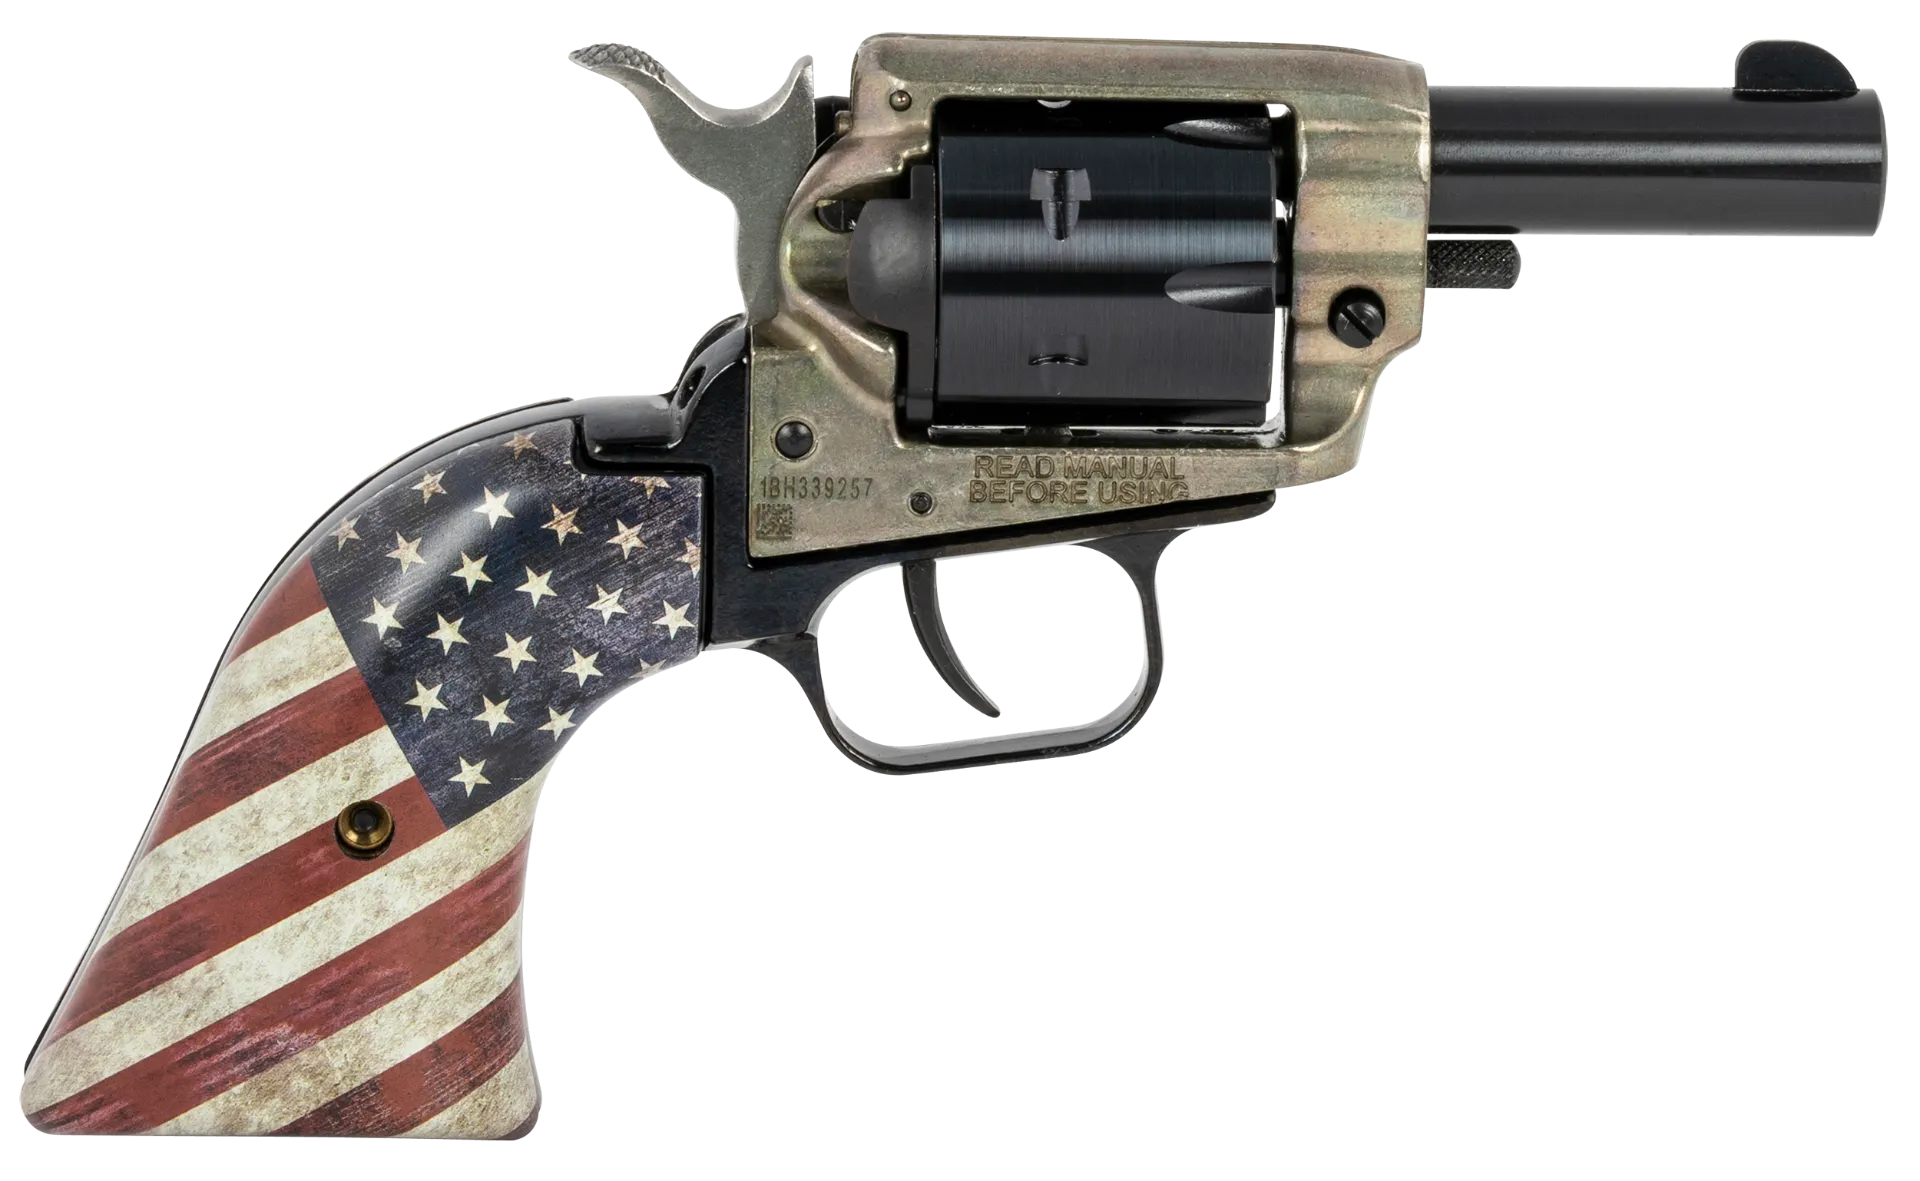
Heritage Barkeep Color Case Hardened .22 LR 2 Barrel 6-Rounds American Flag Grip

Heritage Firearms Rough Rider Nickel .22 LR 4.75 Barrel 6-Rounds
That grid is dominated by rimfires, because the cheapest revolver in a catalog is always a .22. It tells you what entry costs, not whether the .357 you actually want is well priced today. For that you want the specific listing, its vendor count, and its history.
What about Black Friday, tax season and election cycles?
We are not going to tell you.
Our firearm price history begins in February 2026. We have not yet tracked a November, a December or a tax-refund spring, so any claim we made about them would be repetition, not measurement. The honest position is that those effects are widely asserted and, in our data, currently untested. When the window covers them, we will publish what it shows — including if it shows nothing.
What we can say is that the forces driving firearm pricing are not the same ones driving ammunition pricing, which is a genuinely seasonal market with a documented curve. The mechanics are laid out in why ammo prices move and when the cheapest time of year to buy ammo is, and new-product pricing behaviour specifically in what happens when a new cartridge launches.
Budget the ammunition, because that part does move
A gun is a single purchase whose price barely moves. The ammunition is a recurring purchase whose price moves constantly, and over a year of regular shooting it is usually the larger number.
.223 Rem / 5.56 NATO Price Index
Live · Oct 28, 2026Cheapest Bulk .223 / 5.56 Per Round
Prices updated Oct 28, 2026
PMC Ammunition Bronze .223 Rem 55 Grain 1000-Rounds FMJ Bulk
.223 Remington · 55gr · 1,000 rds

Patriot Sports Rifle Ammunition .223 Rem 55 Grain 1000-Rounds FMJ
.223 Remington · 55gr · 1,000 rds

PMC Ammunition X-Tac Rifle Brass 5.56 55 Grain 1000-Rounds FMJBT Bulk
5.56x45mm NATO · 55gr · 1,000 rds

Wolf Performance Ammo PolyFormanc Steel Bulk .223 Rem 55 Grain 500-Rounds
.223 Remington · 55gr · 500 rds

Wolf Military Classic Steel .223 Rem 55 Grain 500-Rounds Bulk FMJ
.223 Remington · 55gr · 500 rds

Red Army Standard Centerfire Rifle Steel .223 Rem 55-Grain 500-Rounds Bulk FMJ
.223 Remington · 55gr · 500 rds
Those blocks update themselves; the figures in the tables above are a fixed measurement of a fixed window. Both are ours, and the difference between them is the point — hardware sits still, ammunition does not. Work out your real annual consumption in how many rounds it takes to get good, then price it against the 5.56 and .223 guide, the 9mm guide, or straight from the .223/5.56 caliber page and the full ammo catalog.
What to do with all of this
- Stop waiting for a month. In our window it cost you a little rather than saving you anything.
- Start watching a listing. One gun in eight swings 10% or more across six months, and you cannot predict which one it will be.
- Check the vendor count before you check the date. Four out of ten multi-retailer guns have a 5%-plus spread sitting there today.
- Add the transfer fee before you compare anything. On an inexpensive gun it dwarfs every effect on this page — see how to buy a gun online for how to price it. If your purchase is on the NFA side, the suppressor buying guide covers a very different timeline.
Our standing rule on what we will and will not claim from this data is written up in how we rank ammunition. It applies to firearms identically: tracked prices and published specifications, nothing inferred, nothing tested in-house.
AmmoSpotter earns a commission when you buy through links on this page. It never changes what you pay, and it never decides what we recommend — our picks are ranked on live cost-per-round data pulled from every retailer we track. Full disclosure.
Frequently Asked Questions
Is there a cheapest month to buy a gun?+
How much does an individual gun's price move over six months?+
Does waiting for Black Friday save money on firearms?+
How much do retailers differ on the same gun?+
Should I buy a gun now or wait for prices to drop?+
Do hunting rifles get cheaper in the off-season?+
Shop the data

About the author
AmmoSpotter Research Desk
Price & Ballistics Research
The AmmoSpotter Research Desk analyzes live retail pricing across every ammunition, firearm and accessory listing we track. Recommendations here are ranked against real cost-per-round data pulled daily from the retailers we monitor - not against manufacturer marketing copy.
- ✓Tracks 180,000+ live product listings across 6 retailer feeds
- ✓Records price history on every listing, every day
- ✓Cost-per-round methodology applied to all ammunition rankings
- ✓No product is ranked without a verifiable in-stock retail price
- ✓Affiliate relationships never influence rankings
Related Guides

How to Buy a Gun Online: FFL Transfers Explained
- A firearm bought online ships to a licensed dealer near you, not to your door. You do the paperwork and the background check in person. - The transfer fee is set by that receiving dealer. It is invisible to every pr...

When Is the Cheapest Time of Year to Buy Ammo? (2026)
The question assumes ammunition behaves like patio furniture — that there is a predictable end-of-season dip, and that a patient buyer beats an impatient one by waiting for it. It does not work that way. The forces th...

Best Bolt Action Rifles for Hunting (2026): Priced Live, Cartridge First
- We track roughly 4,500 bolt-action rifles. The grids below are priced live at the moment you load this page. - Sort any bolt-action category cheapest-first and the top is rimfire, not deer rifles. Read the chamberin...

Which Retailer Is Actually Cheapest for Ammo? What the Price Data Shows
The question is asked as though there is a store-level answer — that one retailer is simply cheaper, the way one grocery chain is cheaper than another, and that once you find it you can stop comparing. Ammunition does...

Gun Deals: How to Tell a Real Discount from a Fake One
- Across 44,390 live firearm listings tracked for 90 days or more, 43.8% have never changed price once . Another 3.9% have moved by less than a single percent. - 63.4% are sitting at their own lowest recorded price ri...
What an FFL Transfer Actually Costs: The Break-Even Math on 62,309 Guns
- The transfer fee is set by your receiving dealer, appears in no retailer feed, and is the one number we genuinely cannot look up for you. - The other half of the arithmetic we can measure exactly. Of 62,309 live fir...